Using the United Nation geoscheme1, the following is a brief summary of significant industry-reported threats and law enforcement activity impacting on various regions globally, based on 2014-2015 data.
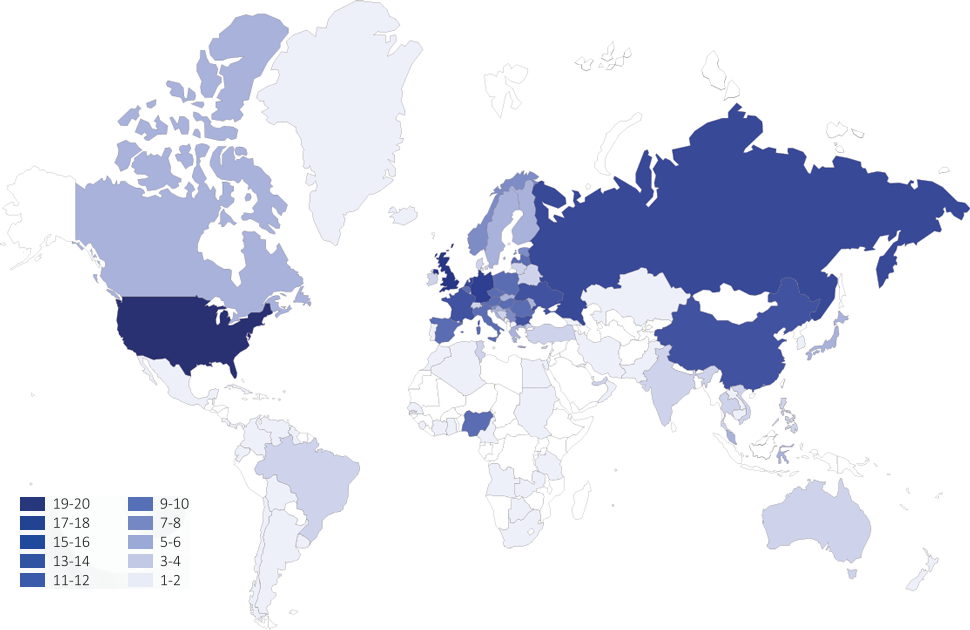
The heat map below highlights the countries and jurisdictions where EU cybercrime investigations have identified offenders and/or infrastructure. This data relates to both cyberdependent crime and cyber-enabled fraud and does not include investigations into online child sexual abuse. With the exception of investigations that led to the US, UK and Germany, fewer than one third of investigations led to an MLAT request being submitted to the country identified as the location of an offender or criminal infrastructure. Whether this reflects alternate means of data sharing, the responsibility of requesting or providing assistance falling to another jurisdiction (including the one in question) as part of a coordinated multi-jurisdictional operation, or simply a lack of confidence in the MLAT system is unclear.
Click on a region on the map below for more information.
Africa's significance in the cybercrime community continues to grow with blended cyber-attacks of increasing sophistication originating from this region. Indicators suggest that African cybercriminals are benefiting from the same products and services available as-a-service on underground marketplaces as their European counterparts2.
Nigeria features as a top 10 country for EU law enforcement in terms of the location of offenders or infrastructure related to cybercrime3.
Furthermore, four out of the five top TLDs (top-level domains) used for phishing are of African origin (.CF, .ZA, .GA and .ML) although with the exception of .ZA (South Africa) these domains were repurposed in 2013 and are now owned by a Netherlands-based company4.
North America maintains its lead in terms of hosting malicious content and the proportion of global victims resident in that region. In 2014 the United States hosted between 20%5 and almost 40%6 of the world's command-and-control servers. The USA also hosts over 45% of the world's phishing domains7 and remains one of the world's top spam producers8 9.
The United States is home to a comparatively high proportion of global bots, harbouring between 16%10 and 20%11 of all bots worldwide. In addition, in 2014 almost one third of PoS malware and over 40% of all ransomware detections were in the USA.
20 EU Member States had investigations where criminal infrastructures or suspected offenders were located in the United States and over 70% of SEPA countries reported losses from the use of skimmed payment cards in the USA, though this should decrease over time as the US finally adopts chip and PIN technology12.
South America featured less in both industry reporting and EU law enforcement investigations in 2014 although both Colombia and Argentina remain in the top 10 countries for sending spam13 14. Poor digital hygiene is still an issue with many South American countries (Ecuador, Guatemala, Bolivia, Peru, Brazil) having high malware infection rates15. Brazil is also often seen as a key player in malware related to PoS and ATM terminals and skimming devices16.
South America (Brazil) is also often seen as a key player in malware related to PoS, ATM terminals – and skimming devices.
Like the US, China continues to feature heavily in Internet security industry threat reporting. In addition, almost half of EU Member States had investigations where criminal infrastructures or offenders appeared to be located in China. Some sources identify China as the source of over 30% of global network attacks17. Along with India18 and South Korea, China features in top 10 lists of countries hosting botnet C&C infrastructure19. China also maintains one of the highest malware infection rates globally20 and is subsequently home to one of the highest proportions of global bots21. India, Indonesia, Malaysia, Taiwan and Japan also host significant bot populations22 23.
Japan would appear to have an increasingly significant role as both a victim and source of cybercrime, featuring as a source of spam24 and, in some reports, having the second highest global detection rate for ransomware25. Japan is also one of the top three countries in Asia where EU law enforcement investigation has identified perpetrators or criminal infrastructure. Japan, South Korea and the Philippines are the most prominent of countries in East and South-East Asia out of which gangs running commercial sexual extortion campaigns are noted to operate.
Several Asian countries feature as top sources of spam, in particular Vietnam26 27 and to a lesser extent India28 and China29. China also features again as a top jurisdiction within Asia for hosting phishing domains, along with Hong Kong30. Although they are not noted for hosting phishing domains, the country code top-level domains (ccTLDs) for both Thailand and Pakistan are commonly used in phishing attacks31.
The Asia-Pacific region is also the territory where most SEPA members report losses arising from the use of skimmed cards. Five out of the top six countries where losses were identified were in this region, with Indonesia most commonly reported, and then to a lesser extent the Philippines, South Korea, Vietnam and Malaysia32.
The fast and reliable ICT infrastructure found in much of Europe, particularly Western Europe, is exploited by cybercriminals to host malicious content and launch attacks on targets both inside and outside of Europe. The EU hosts approximately 13% of global malicious URLs (i.e. online resources that contain redirects to exploits or host exploits themselves). Of these the Netherlands accounts for the most significant proportion while Germany, the UK and Portugal make up much of the remainder. Germany, the UK, the Netherlands, France and Russia also feature as significant hosts for both C&C infrastructure and phishing domains globally33 34. Italy, Germany, the Netherlands, Russia and Spain are also some of the top sources for global spam35 36.
Many European regions – especially in Western Europe - feature some of the lowest global malware infection rates. The Scandinavian countries and Finland typically have the lowest rates37 38.
Within the EU, France, Germany, Italy and to a lesser extent the UK click on the largest number of malicious URLs. This undoubtedly contributes to these states having the highest malware infection rates and the highest proportions of bots found within the EU. This is partly to be expected, however, given that these four jurisdictions have the highest populations in the EU.
In terms of EU law enforcement activity, approximately one half of EU Member States identified infrastructure or suspects in the Netherlands, Germany, Russia or the United Kingdom in the course of their investigations. Moreover, approximately one third found links to Austria, Belgium, Bulgaria, the Czech Republic, France, Hungary, Italy, Latvia, Poland, Romania, Spain or Ukraine.
Australia retains a presence in a number of industry top 10 league tables related to cybercrime including global bot populations, ransomware detections39 and as a source of network attacks40. Other than this, Oceanic countries do not feature prominently in cybercrime reporting or in EU law enforcement investigations.
However, the ccTLD for the Micronesian island of Palau features as the TLD with the second highest proportion of its domains used for phishing; being heavily abused by Chinese phishers41.