The following is a brief summary of geographic threats and cybercrime activity throughout 2015-2016 based on law enforcement and industry data. The overview makes use of the United Nations geoscheme190 and uses the reported data to highlight in which countries European law enforcement has identified criminal suspects and/or infrastructure (CSI) throughout the course of the reporting period. It does not however reflect the number of individual investigations.
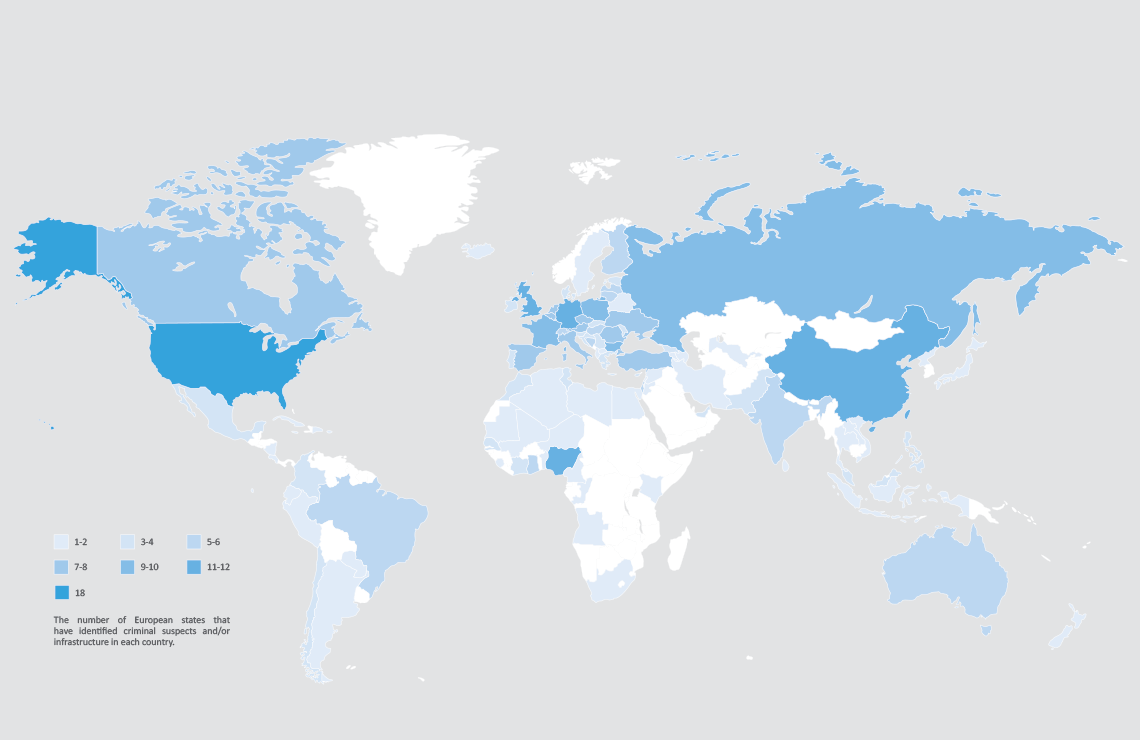
The heat map below highlights the number of European countries that have identified criminal suspects and/or infrastructure (CSI) in each shaded country. Note that this does not reflect the number of individual investigations, simply the number of states that have identified CSI there during the reporting period.
Less than one third of countries identified as the location of CSI were forwarded an MLAT as part of that investigation. There is no apparent pattern to whether a country receives MLAT requests; countries within and outside the EU are as likely or unlikely to be sent an MLAT request. The probability may reflect the nature of individual investigations, individual states’ relationships with the other jurisdiction, or perhaps the use of other information or intelligence sharing pathways, not that this would facilitate requests for evidence.
Click on a region on the map below for more information.
While Africa boasts a rapidly growing internet infrastructure it still has the lowest global internet penetration (28.6%). What it lacks in saturation it makes up for in numbers with almost 10% of global internet users (compared to Europe, which has 17% despite 74% penetration)191. Benefiting from a series of high bandwidth undersea conduits along the eastern and western seaboards, African almost suffers more now from power distribution issues than internet access192.
Arriving somewhat later to the scene, some African nations have profited from being able to skip a number of technology milestones such as landlines and branch banking, instead leaping straight to mobile telephones and online banking. By 2020, smartphone internet connections are expected to exceed those of North America193. This is not without consequence however, as Africa now has one of the highest global mobile malware infection rates194.
While many African states are rapidly adopting cybercrime legislation195, they are still relatively lagging behind when it comes to implementing and practising cyber security.
11 European countries identified CSI in 13 different African states throughout 2015/2016, with Nigeria featuring as a cybercrime hotspot for all 11 European countries. Indeed, Nigeria was the third most frequently identified country as the location for CSI alongside the UK and Germany.
The United States continues to maintain its global lead (~ 30% of global figures196,197) in the hosting of botnet command and control servers. The US was also a top spam sending country in 2015, accounting for up to 16% of global spam and was the largest global host of malicious URLs198 including phishing websites199,200,201. Unsurprisingly the US was the top location identified by European law enforcement for harbouring CSI.
The digital underground in the US largely operates from the Surface Web. As a highly competitive, English-speaking community, this environment attracts many fledgling cybercriminals. The Canadian underground is still in its relative infancy, and largely centres on the sale of forged or stolen ID documents and compromised financial credentials202. Canada would appear to be a growing concern for European law enforcement as it held joint 7th place in terms of destinations where law enforcement identified CSI.
Latin America is a region that registers some of the highest malware infection rates203. Although it varies from month to month, some South American countries such as Chile and Belize host significant proportions of global phishing sites, on occasion surpassing that of the USA204.
Brazil has nurtured a thriving digital underground, although it largely operates openly and brazenly on the Surface Web internet rather than hiding in the Deep Web. While the Brazilian market is dominated by home-grown banking Trojans, almost any recognisable cybercrime tool can be found on these markets205.
Eight European countries identified CSI in South America, with Brazil and Mexico being top destinations, followed by Chile and Colombia.
China has an extensive and increasingly innovative digital underground. While it makes less use of traditional cybercrime forums, instead choosing to use instant messaging or spam on existing (unrelated) fora to drum up business, the range of products and services available mirrors that of Western underground markets. These markets are a key source for tools and equipment relating to card crime, such as ATM and POS skimmers206.
China and Taiwan have some of the highest global malware infection rates and consequently highest volumes of global bots207,208. As a region, Asia also has the highest rate of mobile malware infection after Africa209.
China, Vietnam, India, Japan and Taiwan are reported as top sources of global spam210 ,211. Additionally, Asia is allegedly the source of over 50% of global DDoS attacks, with China alone responsible for over one quarter of these attacks. South Korea, India, Thailand and Japan make up the remainder212.
16 European countries identified CSI in Asia, with 12 of those locating CSI in China. Other common countries for the location of CSI were typically in East or South-East Asia, however India was the second most common Asian country alongside Hong Kong.
While many European countries no doubt have some form of domestic digital underground, Germany is considered by some researchers to have one of the fastest growing underground markets within the EU, although much of its crimeware products focus only on domestic targets213. Russia, or at least Russian speaking countries, are still generally considered to maintain some of the most established cybercrime marketplaces214.
Europe benefits from some of the lowest global malware infection rates215 for both computer and mobile malware216. Out of this however, Germany and France have the highest proportions of connections to C2 infrastructure (effectively a measure of the number of bots) in the EU217. Germany, the Netherlands, France and the UK are top EU countries for the hosting of C&C infrastructure, with the Ukraine and Russia leading the non-EU states218,219. Russia is also the top European country for the hosting of malicious URLs, with the Netherlands not far behind220. While only a representing a fraction of global figures, Italy, Belgium, France, Germany, Italy, the Netherlands and the UK also commonly feature in top 10 lists for hosting phishing websites221.
Within the EU, Spain and Italy are top spam sending countries, with Russia leading within Europe as a whole222. Additionally Spain is consistently one of the top 10 global sources of DDoS, accounting for between 6-7% of global attacks223.
Of the top 20 countries where European states have identified CSI, more than half were other European states, although this may reflect higher levels of cooperation and communication, facilitated by Europol. Germany and the UK were top locations for the identification of CSI with 10 other European states pinpointing each of those jurisdictions.
It is reported that, globally, Australia is one of the top five countries clicking on malicious URLs, and as a likely consequence also one of the top five countries making connections to C2 infrastructure224. Australia does however benefit from one of the lowest mobile malware infection rates225.
While still only a tiny fraction of global figures (less than 1%), Australia hosts a growing number of phishing websites226.
Six European countries identified CSI in Oceania as part of the their investigations, five of those in Australia.